You probably have noticed that: Visual Studio 2010 (VS2010) is about to be released. As of today, the Microsoft website states that VS2010 will be launched on April 12th. I have been playing with various builds since more than a year and I am really looking forward to taking this new version into production, since it comes loaded with plenty of new features for parallel programmers. After the launch you probably have to pay money for it, so grabbing the release candidate (RC) and taking a look at it right now may be worth it!
The feature I am talking about right now is the improved MPI Cluster Debugger that lets you execute MPI debugging jobs either locally or on a cluster, with only a minor configuration task involved. A few days ago at the German Windows-HPC User Group event Keith Yedlin from Microsoft Corp was talking about it and I demoed it live. Daniel Moth has a blog post providing an overview of that feature, MSDN has a walk-through on how to set it up, so I am not going to repeat all that content but instead explain how I am using it (and what I am still missing).
Examining variable values across MPI processes. This is a core requirement on a parallel debugger, as I stated in previous posts already. Visual Studio 2008 did allow for this already, but Visual Studio 2010 improved the way in which you inspect variables, especially if you are switching between threads and / or processes. I am not sure about the official name of the feature, but let me just call it laminate: when you put the mouse pointer over a variable the menu that will appear does not only show you the variable value, in VS2010 it also contains a sticker that you can click to keep this window persistent in front of the editor.

In my debugging workflow I got used to laminate exactly those variables that have different values on the threads and / or processes involved in my program. Whenever I switch to a different thread and / or process that in fact has a different value for that particular variable, the view will become red. This turned out to be very handy!

Debugging MPI applications on a Cluster. This became usable only with Visual Studio 2010 – before it was possible, but involved many configuration steps. In Visual Studio 2008 I complained about the task of setting up the right paths to mpiexec and mpishim – gone in Visual Studio 2010, thanks a lot. If you intend on using Microsoft MPI v2 (either on a Cluster or on a local Workstation) there is no need to configure anything at all, just switch to the MPI Cluster Debugger in the Debugging pane of your project settings. It gets even better: The field Run Environment allows you to select between the execution on your local machine, or on a Windows HPC Server 2008 Cluster:

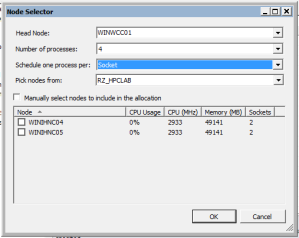
Debugging on a cluster is particularly useful if you program is not capable of being executed with a small number of processes, or if you have a large dataset to do the debugging with and not enough memory on the local machine. The debugging session is submitted to the cluster just like a regular compute job. Setting up your debugging project for the cluster is pretty simple: just select the head node of your cluster and then the necessary resources, that is all. Hint: After selecting the head node immediately select the node group (if any) to reduce the number of compute nodes status information are being queried from, since this may take a while and let the Node Selector dialog become unresponsive for some moments.

After the configuration step you are all set up to F5 to the cluster – once your job has been started you will see no difference to a local debugging session. If you open the Debug -> Processes window from the VS2010 menu you can take a look at the Transport Qualifier column to see which node the debug processes are running on:

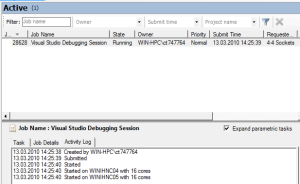
If you are interested, you can start the HPC Job Manager program to examine your debugging session. Unless explicitly object, Visual Studio does the whole job of deploying the runtime for your application and afterwards cleaning everything up again:


What I am still missing. The new features all are really nice, but there are still two very important things that I am missing for an MPI debugger: (i) better management of the MPI processes during debugging, and (ii) a better way to investigate variable values over multiple processes (this may include arrays). Microsoft is probably working on Dev11 already, so I hope these two points will make it into the next product version, maybe even more…
Glad you like the features and thanks for sharing your usage/feedback!
FYI:
The variable inspection in line with the code is called a “DataTip” (a VS2005 feature) and the new VS2010 ability to pin them to source is called a “Sticky DataTip”. The font change to red when the value is different is the classic behavior of variables in the Locals/Watch etc windows, reused for sticky datatips.